


Ethereum Poised for Breakout Above $1,850 as Bullish Momentum Builds
Ethereum eyes a breakout above $1,850 as bullish signals build—rising long positions, increasing open interest, and strong on-chain trends suggest a potential market bottom and Q2 recovery rally.

Ethereum is inching closer to a breakout above the $1,850 resistance level, backed by rising open interest, a surge in long positions, and strengthening on-chain volume trends all signs pointing to a potential market bottom.
Ethereum Struggles While Bitcoin Soars
As Bitcoin confidently breaks past $97,000, Ethereum lingers near the $1,800 mark. Despite this lag, the daily chart hints at a short-term upward trend, potentially setting the stage for a breakout. Could a successful retest ignite a rally toward the key $2,000 psychological barrier?
Ethereum Price Analysis: Bullish Momentum Gaining Ground
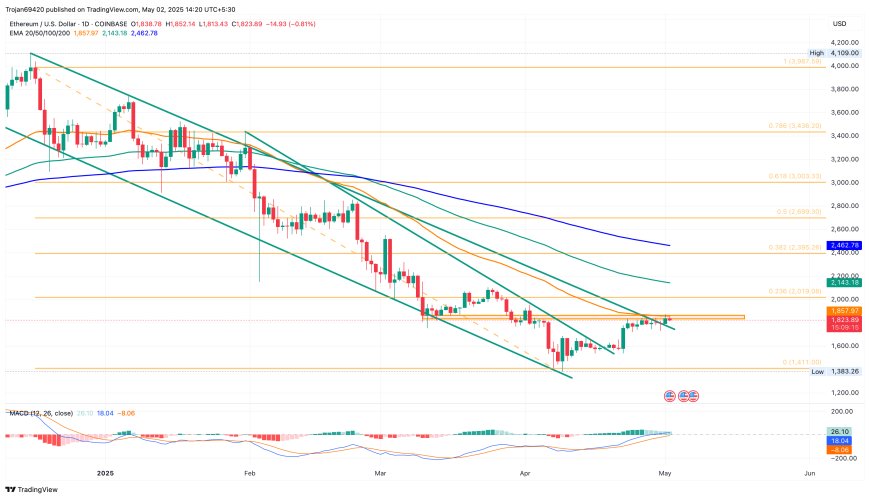
On the daily timeframe, Ethereum has decisively broken through a long-standing resistance trendline, signaling a bullish breakout from its descending channel pattern.
Current Price Action
At the time of writing, Ethereum is trading around $1,821, following a 2.51% gain overnight. However, upward momentum is currently facing strong resistance near the high-volume supply zone at $1,850.
This key resistance level may cause a short-term pullback or consolidation. Still, the upward trajectory has activated a bullish crossover in the MACD and signal lines, signaling growing buyer confidence.
Technical Indicators at a Glance
- 50-Day EMA: This moving average is closely aligned with the supply zone and acts as a dynamic resistance.
- Breakout Watch: A decisive move above the 50-day EMA and $1,850 could confirm a strong bullish signal for price action traders.
Fibonacci Levels:
- Immediate resistance: 23.6% Fib retracement near $2,000
- Major resistance: 200-day EMA and 38.2% Fib retracement around $2,400
- Key Support: Holds firm near $1,600
Derivatives Market: Long Positions Surge on Low Funding Rates
Ethereum's derivatives market shows clear signs of bullish optimism. According to recent data, 53.72% of trades opened in the last 4 hours were long positions, pushing the Long/Short Ratio to 1.1608 a clear bullish tilt.
Open Interest and Funding Rate Insights
- Open Interest: Jumped 3%+, now totaling $21.60 billion
- Funding Rate: Hovering near 0%, making it cheaper to hold long positions a key factor fueling the buying frenzy
Historical Trends Point Toward Q2 Recovery
Looking at historical performance, Ethereum has a strong Q2 track record. Based on CoinGlass data:
- Ethereum has posted positive Q2 gains in 7 of the last 9 years, excluding 2022 and 2024.
- Average Q2 return: ~60%
- Median Q2 return: 12.12%
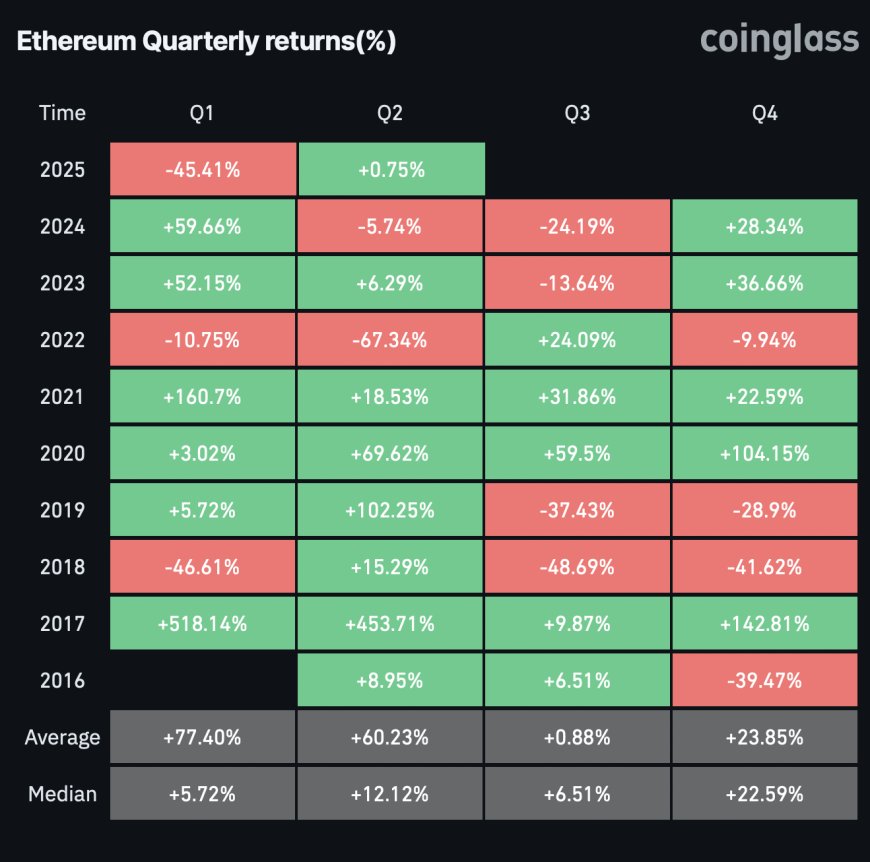
This trend supports the possibility of a significant rebound during the current quarter.
Selling Pressure Eases as Net Taker Volume Turns Positive
Fresh data from CryptoQuant reveals a decline in selling pressure within the derivatives space. The net taker volume flipped positive on April 23 and 24, suggesting increasing buyer dominance.
As of May 1, the 30-day moving average rose to $311,406, indicating a healthier market environment and a potential trend reversal in the making.
Is Ethereum Bottoming Out?
With technical indicators flashing bullish signals, long positions surging, and historical trends aligning in favor of a Q2 recovery, Ethereum might be laying the groundwork for a sustainable uptrend.
A successful breakout above $1,850 could trigger a momentum rally toward $2,000 and beyond, especially if selling pressure continues to decline and macro conditions remain supportive.


